* The indicative performance notifications herein above were determined based on the following stipulations: The Estimated Annualized IRR is the expected net operating income and divided by the capitalization rate of the asset. An investment’s Estimated Annualized Avg Cash Yield is determined by deducting fees and expenses from the current rent roll and other cash flows. We confirm these numbers by comparison with comps received from appraisers. The performance notifications are hypothetical based on the methodology herein above indicated and the actual performance of an investment as stated will vary over time and might not be attained.


Please see Private Placement Memorandum for further details.
| Uses (USD) | |
| Acquisition Price | 6,700,000 |
| Capital Improvements | 1,427,928 |
| Purchase Costs | 531,680 |
| Working Capital & Other Reserves | 40,000 |
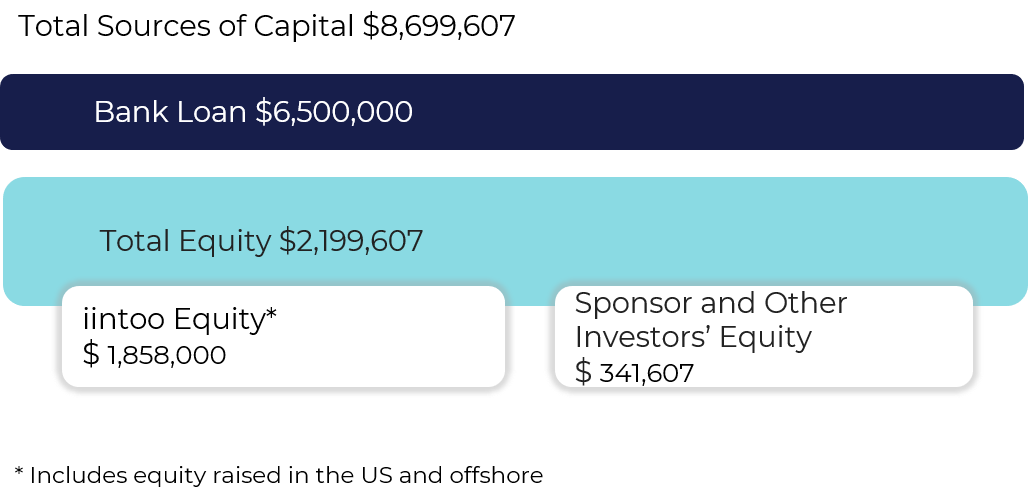
| Total Uses | 8,699,607 |
| Sources (USD) | |
| Sponsor and Other Investors Equity | 341,607 |
| iintoo Equity Investors | 1,179,830 |
| iintoo Debt Investors | 678,170 |
| Total Equity | 2,199,607 |
| Bank Loan | 6,500,000 |
| Total Sources | 8,699,607 |
The Business Opportunity
*Source: Yardi Matrix: Salt Lake City Multifamily Report Summer 2019
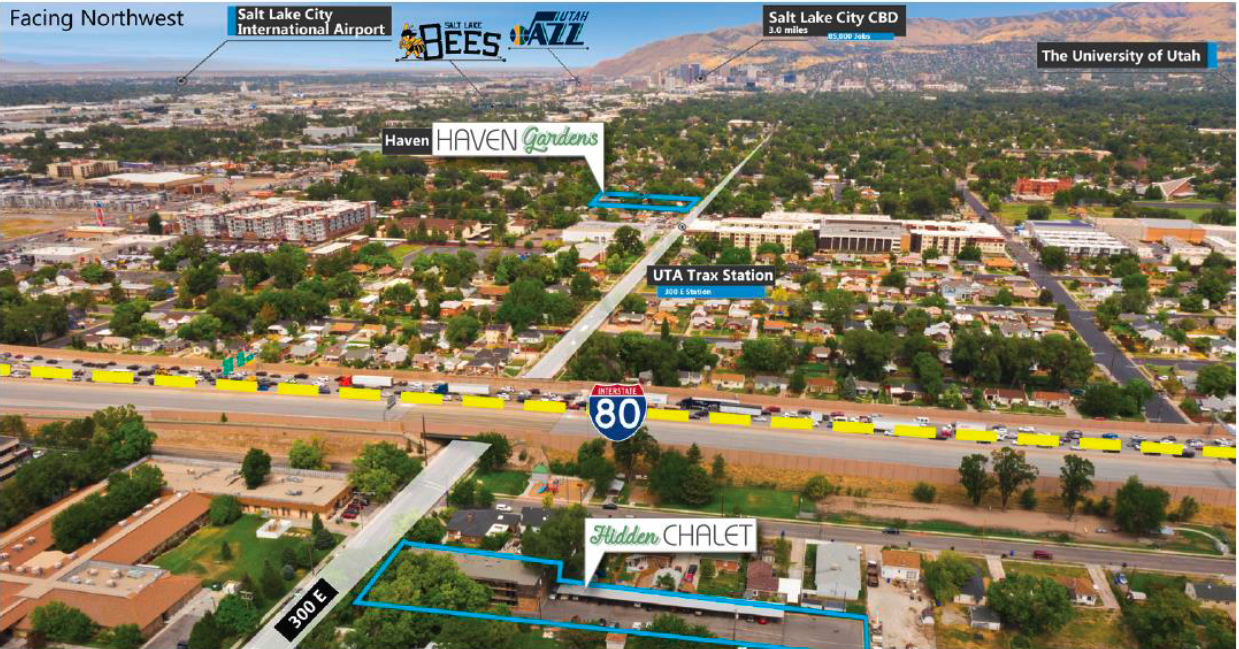
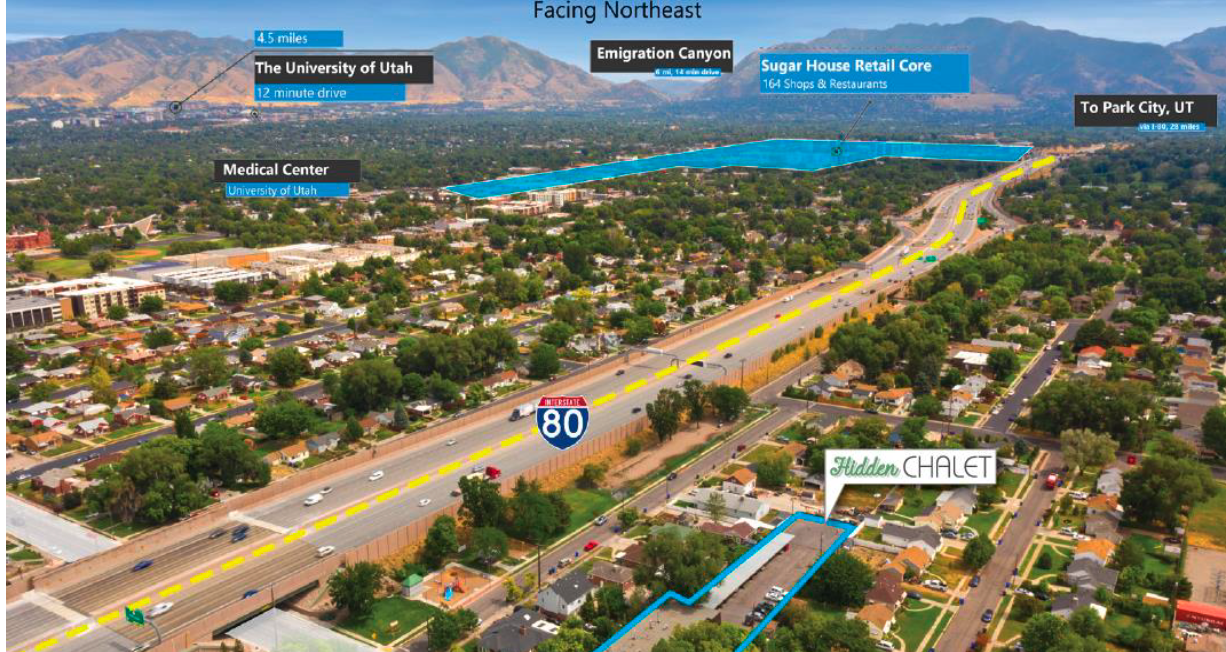
Central Location
Sponsor with Hands-on Local Experience
Growing Market
*Source: Yardi Matrix: Salt Lake City Multifamily Report Summer 2019
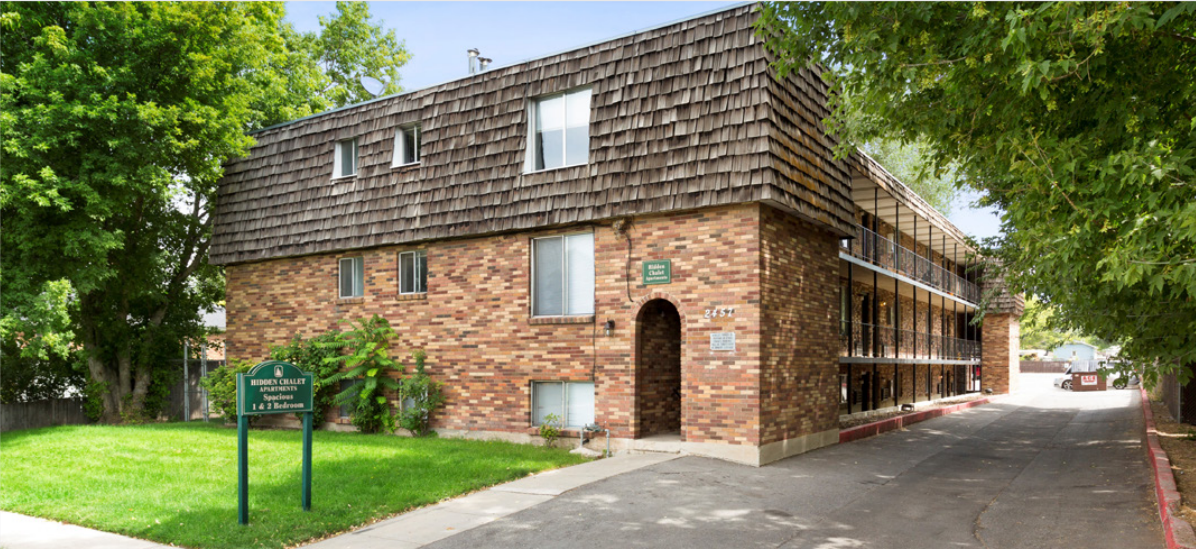
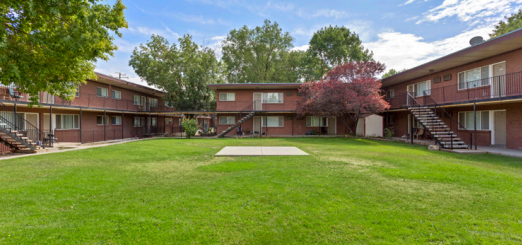
General
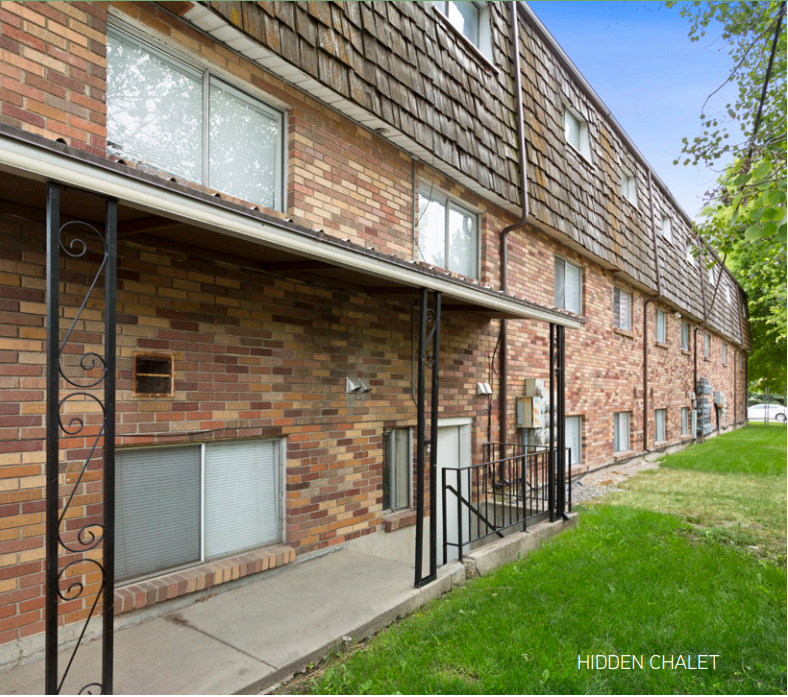
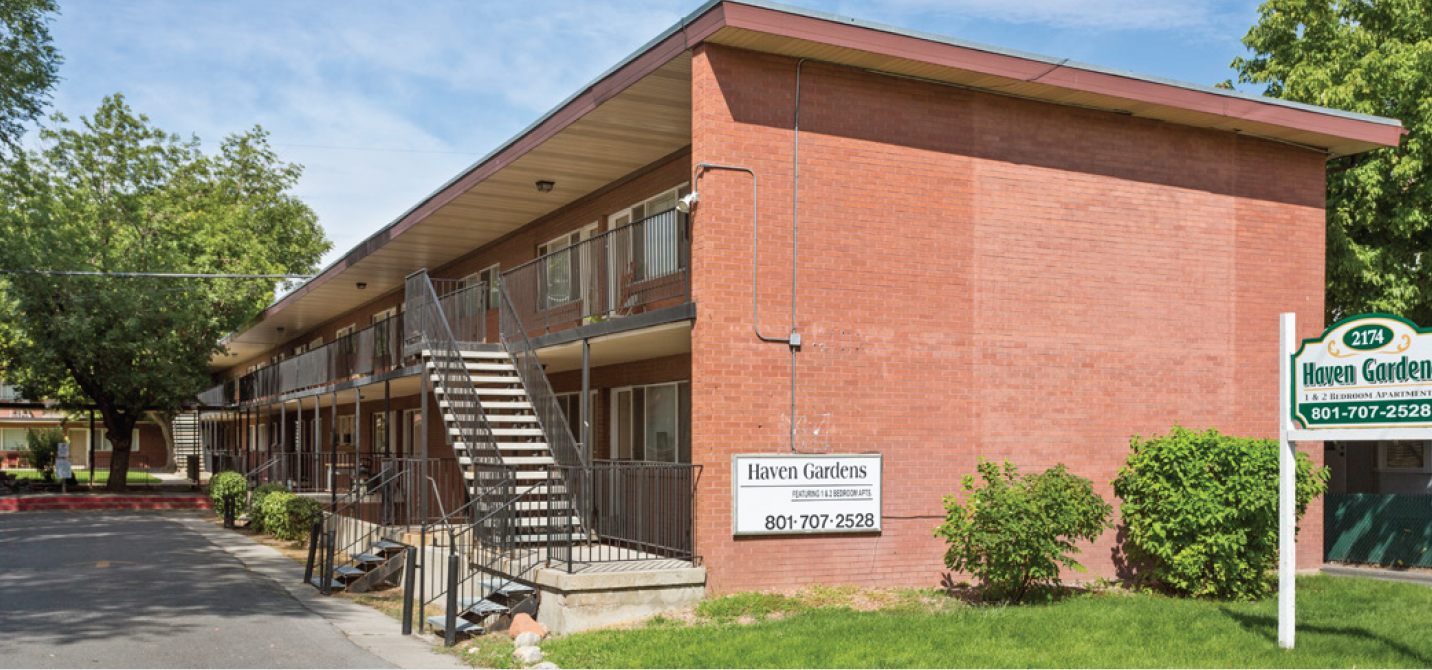
Hidden Chalet comprises 18 units, including 10 one-bedroom units and 8 two-bedroom units. The property's current occupancy rate is 78%. Haven Gardens comprises 41 units, including 26 one-bedroom units and 15 two-bedroom units. The property's current occupancy rate is 83%.
Location
Downtown Salt Lake City is about a 10-minute drive north of the properties, offering abundant restaurants, retail, and nightlife options.
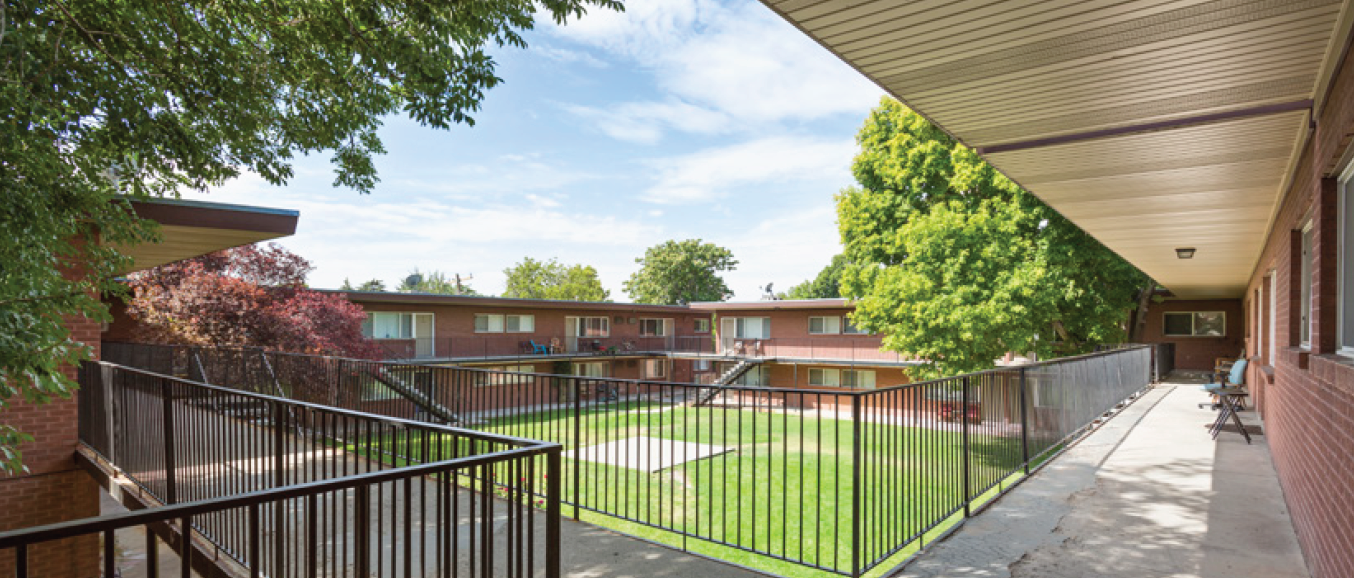
Amenities
- BBQ/picnic area
- Community room
- Upgraded laundry center
Nearby Transportation
Specifications
Nearby Businesses
.png)

Seniority
Based in Santa Monica, CA
Industry Expertise
Unit Track Record
Asset Value Track Record
Regions of Expertise

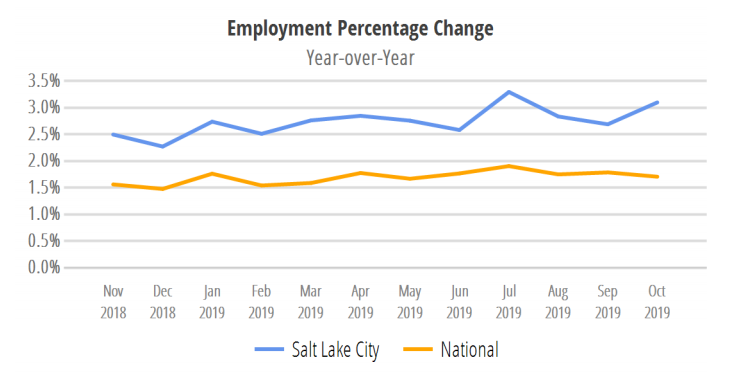
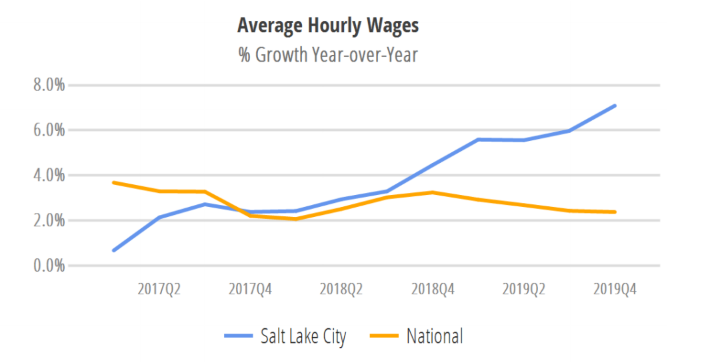
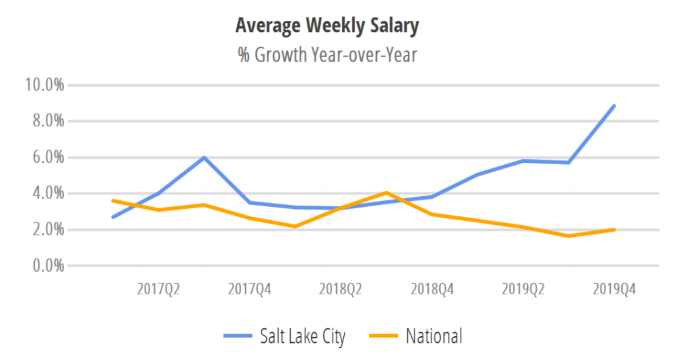
The main industries driving Salt Lake City’s economy are trade, transportation, utilities, government, professional and business services as well as education and health services. Professional and business services is the fastest growing sector in the city, up 5.6% year-over-year. Salt Lake City ranked among the top US metros in job creation, adding 34,100 positions across most sectors, accounting for a 2.6% expansion for the 12-month period ending in June 2019. Not only did the city's employment opportunities grow dramatically, but the salary growth rate rose to over 3 times the national average.*
Although building in Salt Lake City led to a substantial inventory growth, due to robust job and population growth, the city’s multifamily market has remained strong, with average occupancy rates of nearly 96%, exceeding the national average, and 94.6% in the properties’ submarket of South Salt Lake.
Rents in Salt Lake City were up 3% year-over-year as of May 2019, with rents expected to rise 4.6% this year.*
Source: Yardi Matrix: Salt Lake City Multifamily Report Summer 2019
Source: Yardi Matrix
Source: Yardi Matrix
| Projected Cash Flows (USD) | Year 1 | Year 2 | Year 3 |
| Rental Income | 618,688 | 781,694 | 817,171 |
| Payroll | (73,750) | (75,225) | (76,730) |
| Property Taxes | (36,270) | (37,358) | (38,479) |
| Insurance | (12,980) | (13,240) | (13,504) |
| Repairs, Maintenance & Turnover | (32,686) | (33,340) | (34,007) |
| Utilities | (49,560) | (50,551) | (51,562) |
| Marketing & Administration | (23,305) | (23,612) | (23,925) |
| Management Fee | (21,654) | (27,359) | (28,601) |
| Reserve | (14,750) | (14,750) | (14,750) |
| Total Expenses | (264,955) | (275,434) | (281,557) |
| Net Operating Income(NOI) | 353,733 | 506,260 | 535,614 |
| Debt Service | (255,924) | (281,671) | (284,975) |
| Asset Management Fee | (8,092) | (9,622) | (10,013) |
| Application of Working Capital and Other Reserves | 40,000 | 14,750 | 14,750 |
| Net Cash Flow Before Tax | 129,717 | 229,717 | 255,376 |
| Project CoC | 5.9% | 10.4% | 11.6% |
| Expected Cash Flow to iintoo Investors | 109,572 | 194,041 | 215,715 |
| Expected Cash Flow to iintoo - Debt Investors (7% Interest) | 51,100 | 51,100 | 51,100 |
| CoC Debt Investors | 7.0% | 7.0% | 7.0% |
| Expected Cash Flow to iintoo - Equity Investors | 58,472 | 142,941 | 164,615 |
| Expected CoC to iintoo - Equity Investors | 4.4% | 10.7% | 12.3% |
The figures herein above are displayed for illustrational purposes only and are not actual or projected investment performance stipulations. There is no guarantee that this proposed investment will yield profit. Past performance is not a guarantee of future results. Any investment may lose value.
Avg. Rent per Unit | Avg. Rent per SQF | |
Subject Property* (As-Is) | $762 | $1.01 |
Comps (As-Is)** | $987 | $1.27 |
Subject Property* (As-Renovated) | $1,065 | $1.42 |
Comps (As-Renovated)** | $1,089 | $1.41 |
* Refers to Hidden Chalet and Haven Gardens
** Source: Yardi Matrix
| Distribution Waterfall Among iintoo, Sponsor and Other Investors in the JV | |
| NOI for Sale Price Calculation | 535,614 |
| Residual Asset Value @ 5.45% CAP | 9,827,788 |
| Cost of Sale 3% | (294,834) |
| Net Sale Proceeds | 9,532,954 |
| Profit Calculation | |
| Net Sale Proceeds | 9,532,954 |
| Proceeds from Operation | 614,810 |
| Total Proceeds | 10,147,764 |
| Bank Loan | (6,500,000) |
| Return of Capital | (2,199,607) |
| Total Profits for Distribution | 1,448,157 |
| Distribution Waterfall | |
| Expected Cash Flow to iintoo Investors | 519,328 |
| Expected Cash Flow to Sponsor | 95,482 |
| Return of Remaining Capital Contribution - iintoo Investors - Pro Rata | 1,338,672 |
| Return of Remaining Capital Contribution - Sponsor- Pro Rata | 246,125 |
| Hurdle Return to iintoo Investors (10%) - Pro Rata | 557,400 |
| Hurdle Return to Sponsor (10%) - Pro Rata | 102,482 |
| iintoo Share of Profits above Hurdle Return and before iintoo Investors Receive IRR of 18% - Pro Rata (75% Equity Investors, 25% Sponsor) | 499,389 |
| Equity Investors Share of Profits above Hurdle Return and before iintoo Investors Receive IRR of 18% - Pro Rata (75% Equity Investors, 25% Sponsor) | 91,817 |
| Sponsor Promote above Hurdle Return and before iintoo Investors Receive IRR of 18% - Pro Rata (75% Equity Investors, 25% Sponsor) | 197,069 |
| Total Proceeds - iintoo Investors | 2,914,789 |
| Total Proceeds - Sponsor | 732,975 |
| Total Project Proceeds | 3,647,764 |
The figures herein above are displayed for illustrational purposes only and are not actual or projected investment performance stipulations. There is no guarantee that this proposed investment will yield profit. Past performance is not a guarantee of future results. Any investment may lose value.
| iintoo Investors Share | 2,914,789 |
| Return of Capital Contribution to iintoo Debt Investors | 730,000 |
| Interest Payments to Debt Investors 9% per Annum (Including iintoo Success Fee) | 246,375 |
| Return of Capital Contribution to iintoo Equity Investors | 1,342,000 |
| Profit Remaining for Distribution to Equity Investors | 596,414 |
| Total Profit Distribution to iintoo Investors | 2,914,789 |
| iintoo's 20% Success Fee from Profit for Distribution to Equity Investors | 119,283 |
| Net Profit Distribution to iintoo Equity Investors | 477,131 |
The figures herein above are displayed for illustrational purposes only and are not actual or projected investment performance stipulations. There is no guarantee that this proposed investment will yield profit. Past performance is not a guarantee of future results. Any investment may lose value.
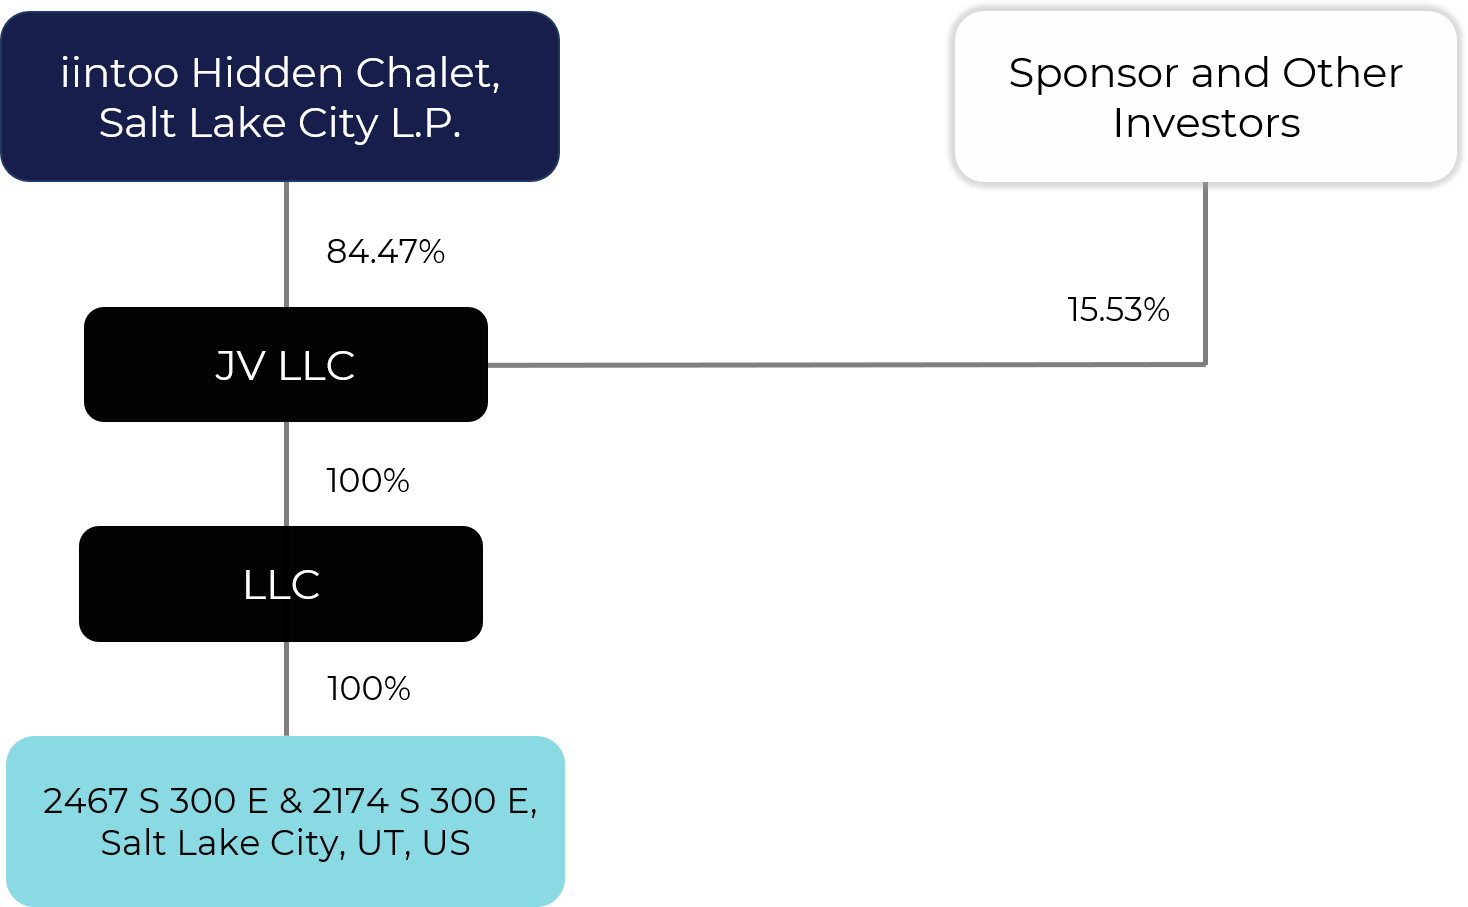
The iintoo investor entity is expected to hold a 84.47% stake in the special purpose entity that owns the asset through a wholly owned subsidiary.
Ownership of the asset is via a designated SPV held by investors. The principal of the Sponsor provides a personal undertaking of the obligations of the Sponsor under the JV agreement. iintoo will oversee and monitor the project until its completion and provide investors with quarterly progress reports.
See Private Placement Memorandum for further details.
The Sponsor has a contractual option to buy out iintoo’s investors stake between 18-30 months from the closing date at a pre-agreed price.
About iintoo
The above may contain forward-looking statements. Actual results and trends in the future may differ materially from those suggested or implied by any forward-looking statements in the above depending on a variety of factors. All written and oral forward-looking statements attributable to us or persons acting on our behalf are expressly qualified in their entirety by the previous statements. Except for any obligations to disclose information as required by applicable laws, we undertake no obligation to update any information contained above or to publicly release the results of any revisions to any statements that may be made to reflect events or circumstances that occur, or that we become aware of, after the date of the publishing of the above.
Private placements of securities accessible through the iintoo™ social network real-estate investment platform (the “Platform”) are intended for accredited investors. Such private placements of securities have not been registered under applicable securities laws, are restricted and not publicly traded, may be subject to holding period requirements, and are intended for investors who do not need a liquid investment. These investments are not bank deposits (and thus are not insured by the FDIC or by any other federal governmental agency), are not guaranteed by and iintoo Investments Ltd. (“iintoo”) or any third party working on our behalf, and may lose value. Neither the Securities and Exchange Commission nor any federal or state securities commission or regulatory authority has recommended or approved any investment or the accuracy or completeness of any of the information or materials provided by or through the Platform. Investors may lose their entire investment as private placements are speculative and illiquid.
Equity securities are offered through Dalmore Group LLC. ("Dalmore"), a registered broker-dealer and member of FINRA (www.finra.org), member of SIPC (www.sipc.org). Any real estate investment accessible though the Platform involves substantial risks. Any financial projections or projected returns are projections only, and iintoo makes no representations or warranties as to the accuracy of such information and accepts no liability therefor whatsoever.
Investors should always conduct their own due diligence, not rely on the financial assumptions or estimates displayed herein, and should always consult with a reputable financial advisor, attorney, accountant, and any other professional that can help them to understand and assess the risks associated with any investment opportunity. Any investment involves substantial risks. Major risks, including the potential loss of some or all principal, are disclosed in the private placement memorandum for each applicable investment.
Neither iintoo nor its affiliates nor Dalmore Group LLC makes investment recommendations nor do they provide investment advisory services, and no communication, including herein or through the Platform or in any other medium should be construed as such. iintoo, its employees and affiliates are not insurers or insurance brokers, and do not offer insurance services, advice or information to new or existing investors.
The Terms of Use regulating your use of the Platform can be found at: https://www.iintoo.com/about-us/terms-of-use/
The Platform's Privacy Policy can be found at: https://www.iintoo.com/about-us/privacy-policy/
By accessing this site and any pages thereof, you agree to be bound by our Terms of Use and Privacy Policy.
The above may include, and we may from time to time make, “forward-looking statements within the meaning of the safe harbor provisions of the U.S. Private Securities Litigation Reform Act of 1995. Forward-looking statements may relate to, among other things, future revenues, earnings, cash flows, capital expenditures, liquidity, and other financial items as well as our business strategy, goals, expectations, and operations. Forward-looking statements can be identified by words such as "anticipate", "believe", "could", "estimate", "expect", "intend", "may", "plan", "project", "will", “seek”, “should”, and similar terms and phrases that necessarily depend on future events. Any forward-looking information contained above is based on present expectations, assumptions, and evaluations regarding future developments and trends and on the interaction of such developments and trends, and are not guarantees. Although we make statements based on reasonable assumptions, there can be no assurances that actual results will not differ from such statements. Forward-looking statements involve inherent uncertainties, risks and changes in circumstances that are difficult to predict. We caution you to not rely unduly on forward-looking statements. Our business and operations involve risks and uncertainties, many of which are outside our control, and any one of which, or a combination of which, could materially affect our performance and whether the forward-looking statements ultimately prove to be correct. All written and oral forward-looking statements attributable to us or persons acting on our behalf are expressly qualified in their entirety by the previous statements. Except for any obligations to disclose information as required by applicable laws, we undertake no obligation to update any forward-looking statement as a result of new information, future developments or otherwise.
Securities accessible through the iintoo™ platform (the “Platform”) are intended for accredited investors. Such securities have not been registered under applicable securities laws, are restricted and not publicly traded, may be subject to holding period requirements, are risky and speculative, and are intended for investors who do not need a liquid investment. Investors must be able to afford the loss of their entire investment. These investments are not guaranteed by iintoo Investments Ltd. (“iintoo”) or any third party working on our behalf, and may lose value. Neither the Securities and Exchange Commission nor any other securities authority has recommended or approved any investment or the accuracy or completeness of any of the information or materials provided by or through the Platform.
Any real estate investment accessible though the Platform involves substantial risks. There can be no assurance that any financial projections, real estate valuations or projected returns viewable through the Platform are accurate or in agreement with market or industry valuation, and iintoo makes no representations or warranties as to the accuracy of such information and accepts no liability therefor whatsoever. Investors should always conduct their own due diligence, not rely on the financial assumptions or estimates displayed on the Platform, and should always consult with a reputable financial advisor, attorney, accountant, and any other professional that can help them to understand and assess the risks associated with any investment opportunity accessible through the Platform.
Neither iintoo nor iintoo GP LLC makes investment recommendations nor do they provide investment advisory services, and no communication, including through the Platform or in any other medium should be construed as such.
The Terms of Use regulating your use of the Platform can be found at: https://www.iintoo.com/terms-of-use/
The Platform's Privacy Policy can be found at: https://www.iintoo.com/privacy-policy/
By accessing this site and any pages thereof, you agree to be bound by our Terms of Use and Privacy Policy.
