* The indicative performance notifications herein above were determined based on the following stipulations: The Estimated Annualized IRR is the expected net operating income and divided by the capitalization rate of the asset. An investment’s Estimated Annualized Avg Cash Yield is determined by deducting fees and expenses from the current rent roll and other cash flows. We confirm these numbers by comparison with comps received from appraisers. The performance notifications are hypothetical based on the methodology herein above indicated and the actual performance of an investment as stated will vary over time and might not be attained.
| Deal Costs | |
| Acquisition Price | 10,775,000 |
| Capital Improvments | 885,148 |
| Purchase Costs | 756,906 |
| Working capital & Other Reserves | 240,000 |
| Total Deal Costs | 12,657,054 |
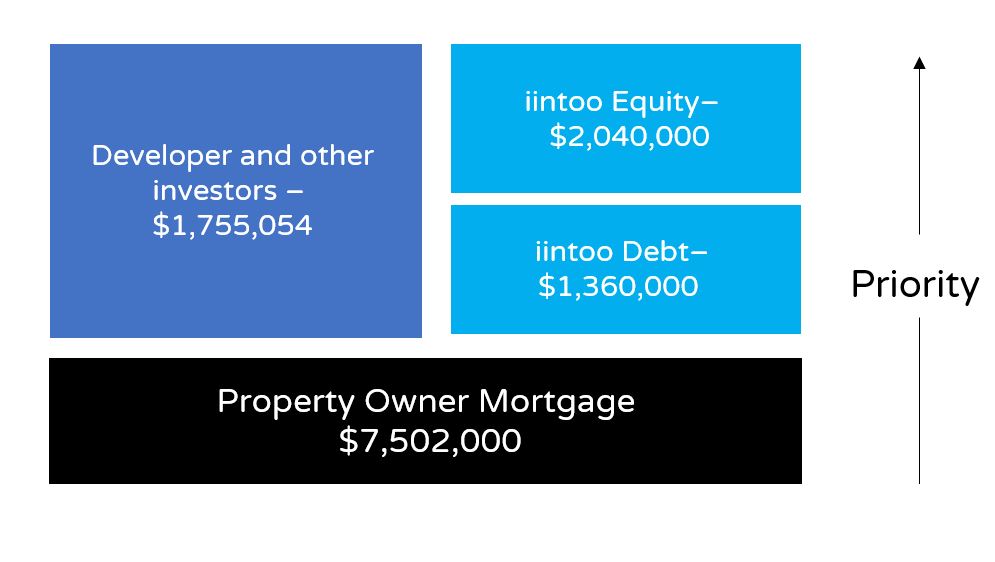
| Sources | |
| Developer and other investors Equity | 1,755,054 |
| iintoo Equity investors | 2,040,000 |
| iintoo Debt investors | 1,360,000 |
| Total Equity | 5,155,054 |
| Bank Loan | 7,502,000 |
| Total Sources | 12,657,054 |
* Projected returns
** Eligible to receive returns prior to the sponsor
- Experienced and successful sponsor company
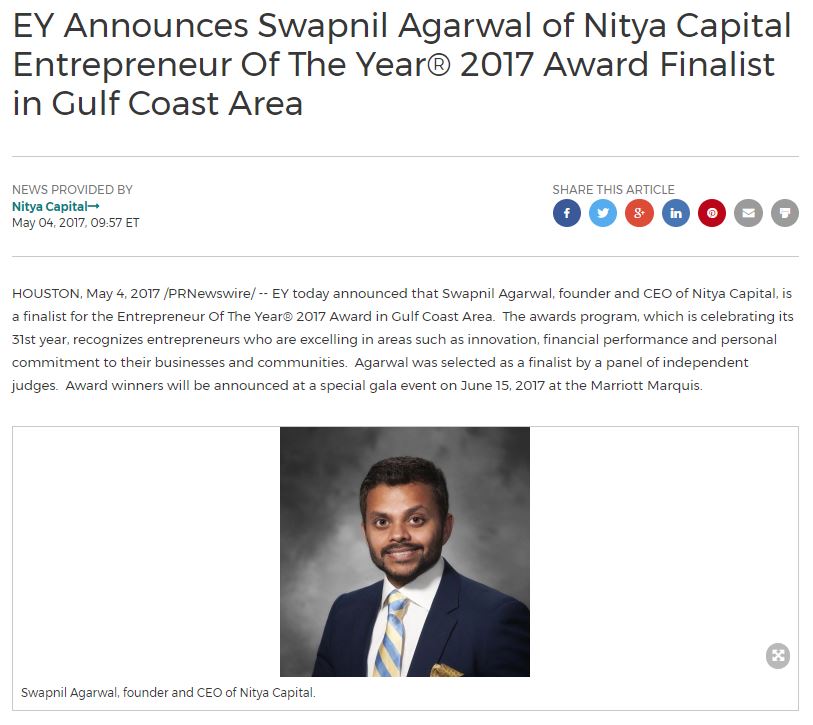
- This is iintoo's third investment with Nitya Capital, whose performance to date on the first two investments has been excellent.
- Nitya Capital is an experienced company, specializing in purchasing and managing multifamily projects.
- The company's managing principal was a finalist for the Ernst & Young Entrepreneur of the Year Award in 2017.
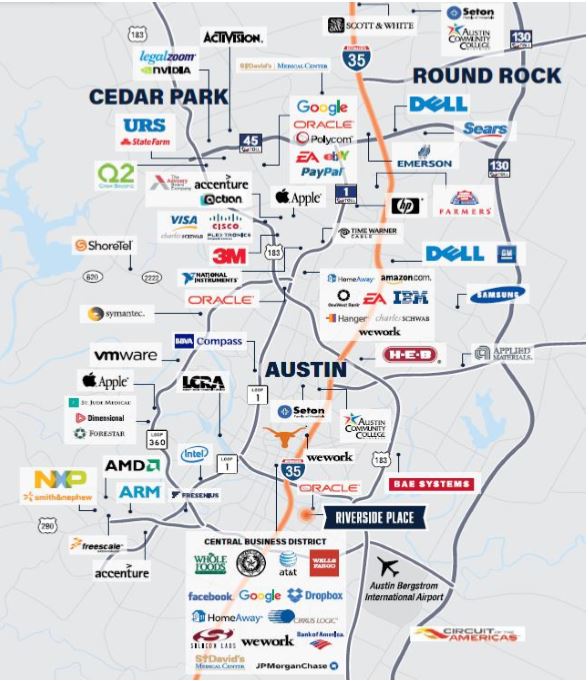
- Top-ranked city and state
- Citing a wide range of favorable macroeconomic factors (from GDP to job growth), reputable publications such as Forbes and US News and World Report have for the past several years given Austin a high ranking on a number of lists including ranked #1 on Forbes’ annual list of best cities for jobs and the best place to live in the United States (The US News & World Report survey).
- Income-generating asset
- The property is expected to generate quarterly income for investors in virtue of the projected rental income. The projected annual cash on cash is 5.2%
- High occupancy rate - The current occupancy rate at the property is 95%.
- An opportunity to increase rents by upgrading the property and replacing the management company.
- Only 17% of the units have been renovated to a "mid–scope" level. The rental prices of the renovated units are significantly higher than those of the rest of the units. Given the market's appetite for renovated units (most comparable properties in the area have been renovated), the sponsor expects that the renovation will lead to an increase in rental prices.
- In accordance with iintoo's agreement with the sponsor, the loan's terms and conditions will be finalized by the closing date.
- Investor protections
- Ownership of the asset via a designated company held by the investors.
- The principal of the sponsor has provided a personal undertaking of the obligations of the sponsor under the JV agreement.
- iintoo will oversee and monitor the project until its completion and provide investors with quarterly progress reports.
- Buy out - The sponsor has an option to buy out iintoo’s investors’ stake starting 18 months from the closing date.
General
Location
In addition to a burgeoning downtown and prosperous employment opportunities the city offers many museums, performing arts venues, sporting events and recreational activities. Affectionately called The Live Music Capital of the World, Austin boasts over 1,700 live music venues and is home to South by Southwest (SXSW) and the ACL Music Festival, two of America’s largest media events.
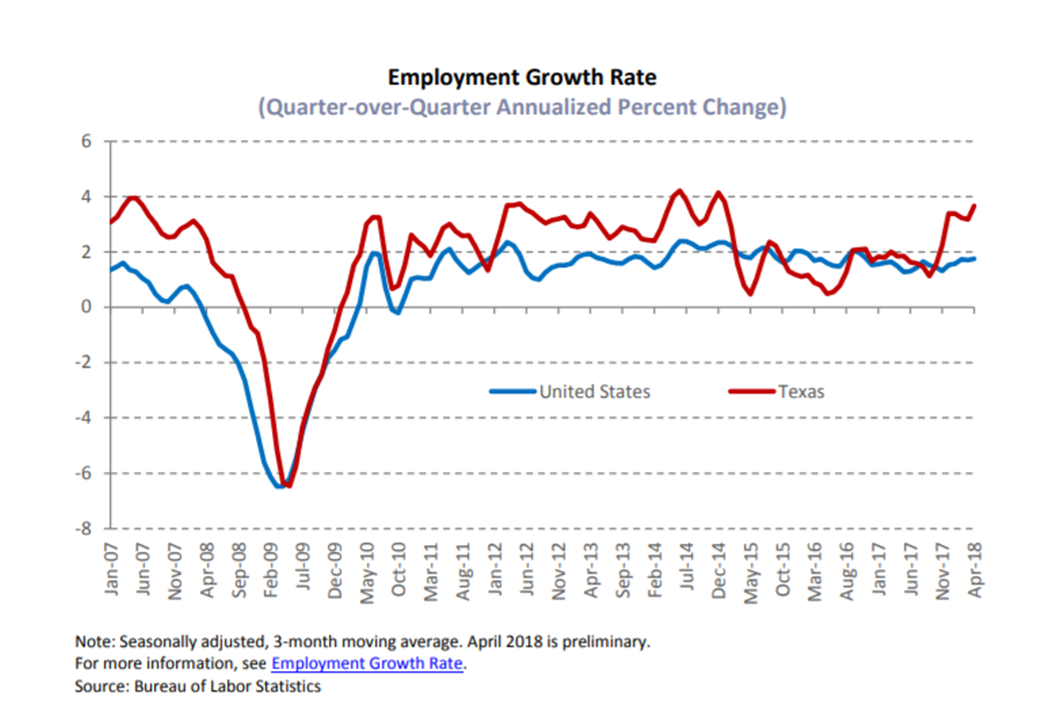
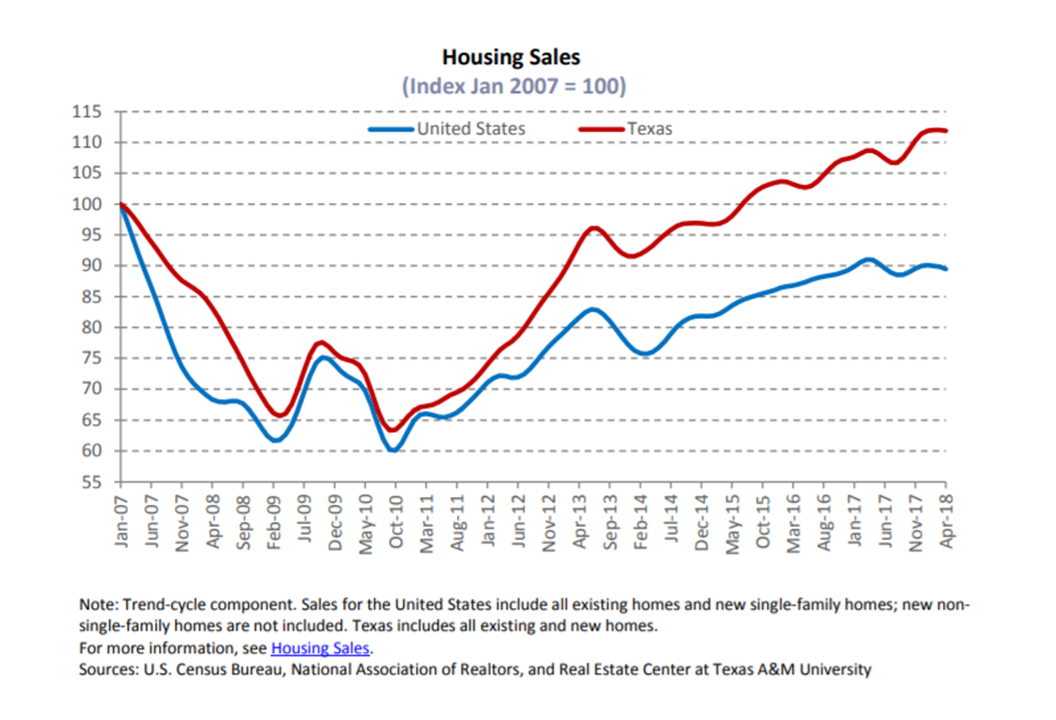
In terms of recession resilience, the economy in Austin was less effected during the Great Recession of 2008 than the rest of the country. Austin was among the first markets in the country to start its vacancy recovery, and the magnitude of the rebound was impressive.
Amenities
• Pool
• Playground
• Poolside BBQ Grills
• Coffee Bar
• Poolside Wi-Fi
• Charcoal BBQ grills
• Dog Park
• On-site Laundry Facility
Nearby Transportation
Nearby Businesses


Industry Expertise
Unit Track Record
Asset Value Track Record
Below are various stats and figures pertaining to Austin's economy:
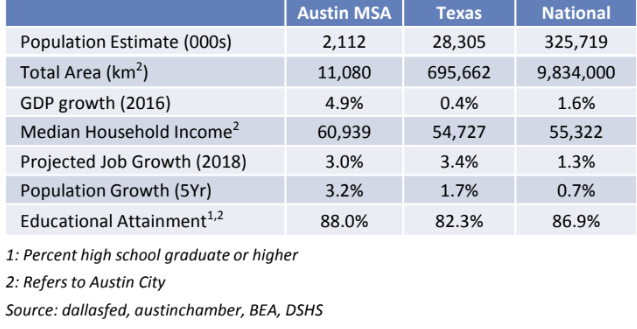
• Over the last 5 years, real per capita GDP is up 16.6%, making Austin the fourth best performing major metro. [Austin Chamber]
• Between 2013-2015, Austin's job growth averaged 4.5% annually, one of the strongest markets in the country. [CoStar]
• In terms of GDP growth, among the top 100 US metros, Austin was the 6th fastest-growing in 2016. [Bureau of Economic Analysis]
•Per The US News & World Report survey, Austin has been named the best place to live in the United States. Austin earned an overall score of 7.8 out of 10. The ranking was the culmination of scores in desirability, value, job market, quality of life and net migration.
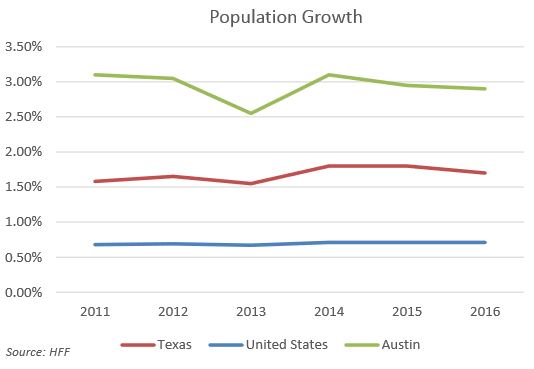
• The Austin MSA ranks in the top 10 among all metros for both numeric & percentage population increase in 2017 & Hays County was the 4th fastest growing county.
• Austin ranked #1 on Forbes’ annual list of best cities for jobs.
• Austin is the 2nd fastest growing large metro based on job growth in 2017. [The Bureau of Labor Statistics]
• Austin is sometimes referred to as the “Silicon Hills”, mainly due to the large number of technology companies who have operations here. Austin includes 3M, Apple Inc., Hewlett-Packard, Google, Whole Foods, Amazon, AMD, Cisco Systems, eBay/PayPal, Intel, Oracle Corporation, etc.
| Year 1 | Year 2 | Year 3 | |
| Rental income | 1,410,818 | 1,539,106 | 1,643,357 |
| Payroll | (155,000) | (159,650) | (164,440) |
| Property taxes | (230,772) | (237,695) | (244,826) |
| Insurance | (27,900) | (28,737) | (29,599) |
| Repairs, Maintenance & Turnover | (34,100) | (35,123) | (36,177) |
| Utilities | (195,563) | (201,430) | (207,473) |
| Market & Administration | (60,720) | (62,542) | (64,418) |
| Management fee | (56,433) | (61,564) | (65,734) |
| Total expenses | (760,488) | (786,741) | (812,666) |
| Net operating income | 650,330 | 752,365 | 830,691 |
| Debt Service | (315,502) | (344,272) | (466,206) |
| Asset management fee | (14,108) | (15,391) | (16,434) |
| Capital Expenditure | (31,000) | (31,000) | (31,000) |
| Application of working capital and other reserves | 105,000 | 45,000 | 90,000 |
| Net Cash flow before tax | 394,720 | 406,702 | 407,051 |
| Project CoC | 7.7% | 7.9% | 7.9% |
| Expected Cash flow for iintoo investors | 260,336 | 268,239 | 268,470 |
| Expected Cash flow for iintoo - Debt investors (10% interest) | 146,200 | 146,200 | 146,200 |
| Expected Cash flow for iintoo - Equity investors | 114,136 | 122,039 | 122,270 |
| Expected CoC for iintoo - Equity investors | 4.9% | 5.3% | 5.3% |
| Distribution waterfall between iintoo, Developer and other investors in the JV | |
| NOI for Sale Price Calculation | 830,691 |
| Residual Asset Value @ 5.35% CAP | 15,526,932 |
| Cost of Sale 2% | (310,539) |
| Net Sale Proceeds | 15,216,393 |
| Profit calculation | |
| Net Sale Proceeds | 15,216,393 |
| Proceeds from operation | 1,208,474 |
| Total proceeds | 16,424,867 |
| Bank Loan | (7,384,934) |
| Return of Capital | (5,155,054) |
| Total profits for distribution | 3,884,879 |
| Distrubtion Waterfall | |
| Expected Cash flow for iintoo investors | 797,045 |
| Expected Cash flow for developer and other equity investors | 411,429 |
| Return of the rest of Capital contribution - iintoo investors - pro rata | 2,602,955 |
| Return of the rest of Capital contribution - developer and other equity investors - pro rata | 1,343,626 |
| Hurdle return for iintoo investors (8%) - pro rata | 816,000 |
| Hurdle return for developer and other equity investors (8%) - pro rata | 421,213 |
| iintoo share of profits above hurdle return and before iintoo investors receives IRR of 18.52% - pro rata (70% Equity investors, 30% Developer) | 1,222,382 |
| Equity investors share of profits above hurdle return and before iintoo investors receives IRR of 18.52% - pro rata (70% Equity investors, 30% Developer) | 630,984 |
| Developer promote above hurdle return and before iintoo investors receives IRR of 18.52% (30% Developer, 70% Equity Investors) | 794,300 |
| Total proceeds- iintoo Investors | 5,438,382 |
| Total proceeds- developer and other equity investors | 3,601,552 |
| Total project proceeds | 9,039,933 |
| iintoo Investors Share | 5,438,382 |
| Return of capital contribution for iintoo Debt investores | 1,462,000 |
| Interest payments for Debt investors 10% per annum (including iintoo success fee) | 548,250 |
| Return of capital contribution for iintoo Equity investores | 2,319,000 |
| Profit remain for distribution for Equity investors (not including iintoo success fee) | 1,109,132 |
| Total Profit distribution for iintoo investores | 5,438,382 |
| Total Capital Raised | 2,319,000 |
| Profit | 1,109,132 |
| iintoo success fee (%) | 20.0% |
| iintoo success fee ($) | 221,826 |
| Total return to investors | 3,206,305 |
| Deduction of Total Capital Raised | 2,319,000 |
| Total profit for 36 months (before Tax) | 887,305 |
| Target yield per annum | 12.75% |
| Net profit per capital unit | 34,566 |
| Expected profit per capital unit | 9,566 |
| Total Capital Raised | 2,319,000 |
| Profit | 1,109,132 |
| iintoo success fee (%) | 20.0% |
| iintoo success fee ($) | 221,826 |
| Total return to investors | 3,206,305 |
| Deduction of Total Capital Raised | 2,319,000 |
| Total profit for 36 months (before Tax) | 887,305 |
| Target yield per annum | 12.75% |
| Net profit per capital unit | 69,131 |
| Expected profit per capital unit | 19,131 |
18 months after the project start date, the sponsor is entitled to a buy-out right that should amount to a return to the iintoo investor entity of 18.52% IRR plus 7% on the closing capital.
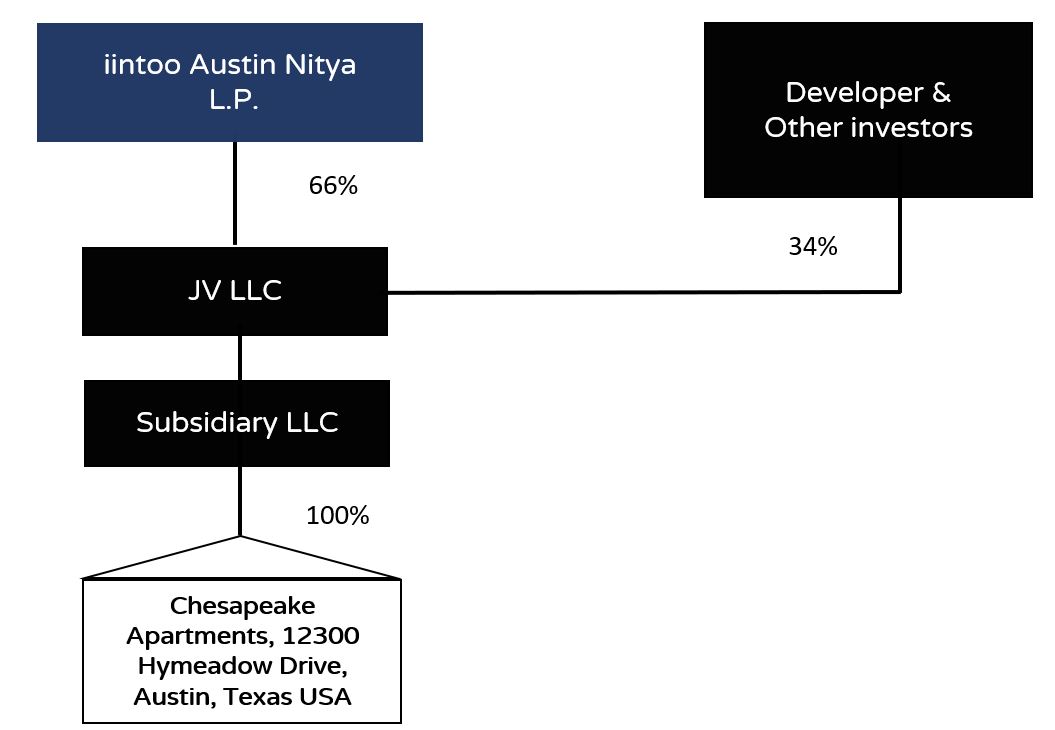
iintoo's Equity investors are expected to hold a 65.95% stake in the asset
About iintoo
The above may contain forward-looking statements. Actual results and trends in the future may differ materially from those suggested or implied by any forward-looking statements in the above depending on a variety of factors. All written and oral forward-looking statements attributable to us or persons acting on our behalf are expressly qualified in their entirety by the previous statements. Except for any obligations to disclose information as required by applicable laws, we undertake no obligation to update any information contained above or to publicly release the results of any revisions to any statements that may be made to reflect events or circumstances that occur, or that we become aware of, after the date of the publishing of the above.
Private placements of securities accessible through the iintoo™ social network real-estate investment platform (the “Platform”) are intended for accredited investors. Such private placements of securities have not been registered under applicable securities laws, are restricted and not publicly traded, may be subject to holding period requirements, and are intended for investors who do not need a liquid investment. These investments are not bank deposits (and thus are not insured by the FDIC or by any other federal governmental agency), are not guaranteed by and iintoo Investments Ltd. (“iintoo”) or any third party working on our behalf, and may lose value. Neither the Securities and Exchange Commission nor any federal or state securities commission or regulatory authority has recommended or approved any investment or the accuracy or completeness of any of the information or materials provided by or through the Platform. Investors may lose their entire investment as private placements are speculative and illiquid.
Equity securities are offered through Dalmore Group LLC. ("Dalmore"), a registered broker-dealer and member of FINRA (www.finra.org), member of SIPC (www.sipc.org). Any real estate investment accessible though the Platform involves substantial risks. Any financial projections or projected returns are projections only, and iintoo makes no representations or warranties as to the accuracy of such information and accepts no liability therefor whatsoever.
Investors should always conduct their own due diligence, not rely on the financial assumptions or estimates displayed herein, and should always consult with a reputable financial advisor, attorney, accountant, and any other professional that can help them to understand and assess the risks associated with any investment opportunity. Any investment involves substantial risks. Major risks, including the potential loss of some or all principal, are disclosed in the private placement memorandum for each applicable investment.
Neither iintoo nor its affiliates nor Dalmore Group LLC makes investment recommendations nor do they provide investment advisory services, and no communication, including herein or through the Platform or in any other medium should be construed as such. iintoo, its employees and affiliates are not insurers or insurance brokers, and do not offer insurance services, advice or information to new or existing investors.
The Terms of Use regulating your use of the Platform can be found at: https://www.iintoo.com/about-us/terms-of-use/
The Platform's Privacy Policy can be found at: https://www.iintoo.com/about-us/privacy-policy/
By accessing this site and any pages thereof, you agree to be bound by our Terms of Use and Privacy Policy.
The above may include, and we may from time to time make, “forward-looking statements within the meaning of the safe harbor provisions of the U.S. Private Securities Litigation Reform Act of 1995. Forward-looking statements may relate to, among other things, future revenues, earnings, cash flows, capital expenditures, liquidity, and other financial items as well as our business strategy, goals, expectations, and operations. Forward-looking statements can be identified by words such as "anticipate", "believe", "could", "estimate", "expect", "intend", "may", "plan", "project", "will", “seek”, “should”, and similar terms and phrases that necessarily depend on future events. Any forward-looking information contained above is based on present expectations, assumptions, and evaluations regarding future developments and trends and on the interaction of such developments and trends, and are not guarantees. Although we make statements based on reasonable assumptions, there can be no assurances that actual results will not differ from such statements. Forward-looking statements involve inherent uncertainties, risks and changes in circumstances that are difficult to predict. We caution you to not rely unduly on forward-looking statements. Our business and operations involve risks and uncertainties, many of which are outside our control, and any one of which, or a combination of which, could materially affect our performance and whether the forward-looking statements ultimately prove to be correct. All written and oral forward-looking statements attributable to us or persons acting on our behalf are expressly qualified in their entirety by the previous statements. Except for any obligations to disclose information as required by applicable laws, we undertake no obligation to update any forward-looking statement as a result of new information, future developments or otherwise.
Securities accessible through the iintoo™ platform (the “Platform”) are intended for accredited investors. Such securities have not been registered under applicable securities laws, are restricted and not publicly traded, may be subject to holding period requirements, are risky and speculative, and are intended for investors who do not need a liquid investment. Investors must be able to afford the loss of their entire investment. These investments are not guaranteed by iintoo Investments Ltd. (“iintoo”) or any third party working on our behalf, and may lose value. Neither the Securities and Exchange Commission nor any other securities authority has recommended or approved any investment or the accuracy or completeness of any of the information or materials provided by or through the Platform.
Any real estate investment accessible though the Platform involves substantial risks. There can be no assurance that any financial projections, real estate valuations or projected returns viewable through the Platform are accurate or in agreement with market or industry valuation, and iintoo makes no representations or warranties as to the accuracy of such information and accepts no liability therefor whatsoever. Investors should always conduct their own due diligence, not rely on the financial assumptions or estimates displayed on the Platform, and should always consult with a reputable financial advisor, attorney, accountant, and any other professional that can help them to understand and assess the risks associated with any investment opportunity accessible through the Platform.
Neither iintoo nor iintoo GP LLC makes investment recommendations nor do they provide investment advisory services, and no communication, including through the Platform or in any other medium should be construed as such.
The Terms of Use regulating your use of the Platform can be found at: https://www.iintoo.com/terms-of-use/
The Platform's Privacy Policy can be found at: https://www.iintoo.com/privacy-policy/
By accessing this site and any pages thereof, you agree to be bound by our Terms of Use and Privacy Policy.
